
One of the themes we have been discussing over the past year is the role of analytics in healthcare to help improve quality, efficiency and outcomes. Visibility has long been lacking in the industry because of the scattered and disparate data, lack of standard collection and reporting formats and deliberate opacity keep mark ups as high as possible. Many industry players are gaming the system; chasing incentives that reward quantity over quality, choosing to pay executives millions of dollars in salaries while steadily cutting other budget line items, selling medicine through five intermediaries to create virtual shortages – the list goes on.
The government collects (and releases) more data than anyone else concerning services rendered and reimbursement prices through the CMS database, which is a good source to use for reporting on Medicare and Medicaid procedures and the relative performance of Nursing Homes.
ACO reporting requirements should make reporting and improved outcomes easier to understand. Once it is implemented we should have a good base of data to understand that is much easier to access and show how the quality is improving.
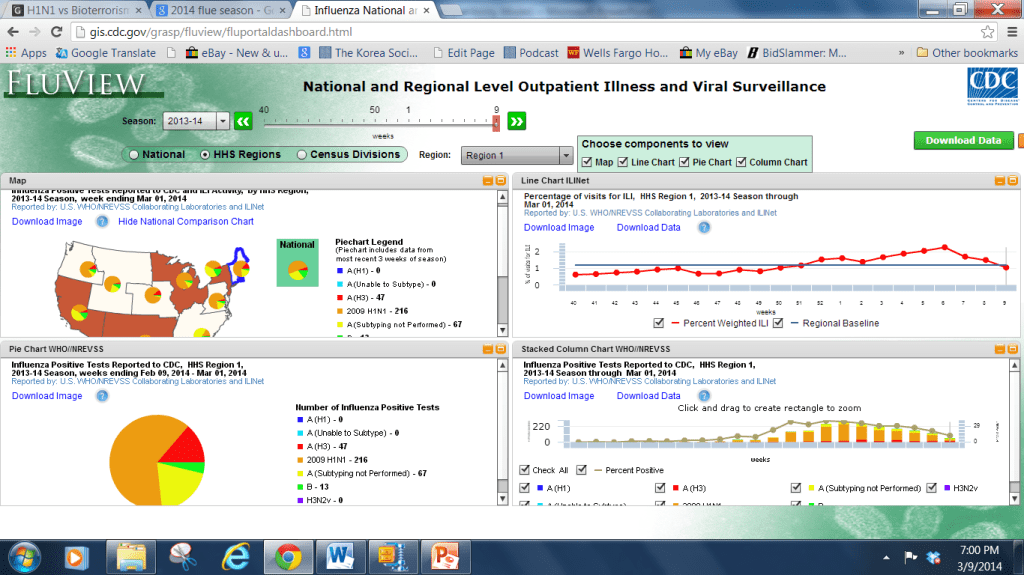
Searching for data on the current flu season, we ran into this CDC dashboard, which is a good interactive source of information and an example of how the government can improve visibility using the explosion of healthcare data.


0 Comments