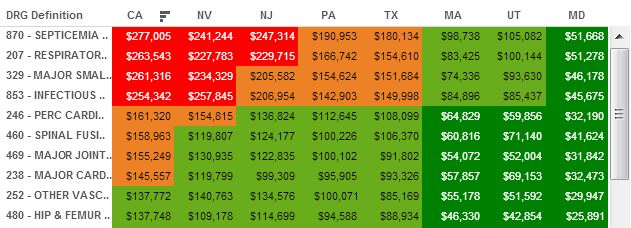
These interactive chart were created using the end of 2Q 2013 CMS Database.  The show the volume of procedures by category (DRG) and  State down to the hospital level. Moving through the tabs left to right, drill down on data by selecting state and other variables.


0 Comments