Sentinel EventsÂ
Definition of a Sentinel Event according to The Joint Commission (TJC):
“A sentinel event is an unexpected occurrence involving death or serious physical or psychological injury, or the risk thereof. Serious injury specifically includes loss of limb or function. The phrase, “or the risk thereof” includes any process variation for which a recurrence would carry a significant chance of a serious adverse outcome. Such events are called “sentinel” because they signal the need for immediate investigation and response.†– TJC Website, 8/28/2013
As part of an overall look at publically available information on Healthcare Quality as the industry moves toward more vigorous reporting requirements for the Affordable Care Act (ACA), we downloaded some of the data on Sentinel Events from the TJC website and found some interesting statistics, which we put into consolidated format to answer some questions about Sentinel Events. Some important facts that surfaced include analysis from the following table, click to expand:

Data from the table suggest:
- Over half (~55%) of sentinel events involved the top five issues of Wrong Site/Wrong Side Surgery, Delay in Treatment, Unintended Retention of a Foreign Body, Op/Post Op Complication and Suicide,
- While there were substantial jumps in these top five issues between 2010 and 2011, the three year compound growth was relatively small when compared to some other areas,
- The following saw large increases between 2010 and 2011:
- Transfusion Error – up 300% in 2011 and had a 79% CAGR between 2010 and 2012
- Restraint-related Error – up 200% with an 18% CAGR
- Anesthesia-related Error – up 167% with CAGR of 8%
- Inpatient Drug Overdose – up 133% with an 66% CAGR
- Ventilator Death compound annual growth rate of 41% Â between 2010 and 2012
- Other important facts not shown in the table include 66% of Events were self-reported and 65% happened in Hospitals, 11% in Psychiatric Hospitals and 60% resulted in the death of the patient.
Root Causes
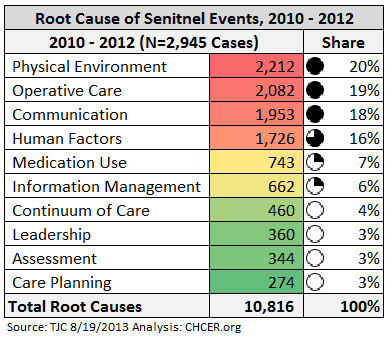 The overall root causes of these events are shown in the attached Table; The Top Five Root Causes account for ~80% of the Total, which can include multiple Causes for each Event.
Physical Environment, Operative Care and Communication errors accounted for almost 60% of the total.
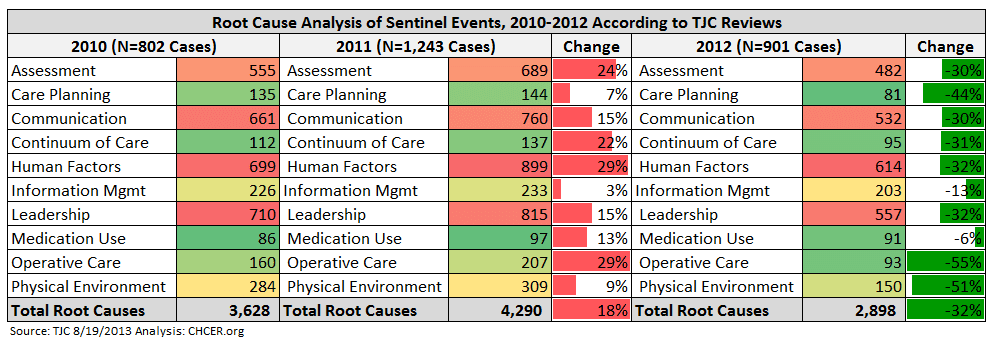
For a view of how this has changed over time, please see the following chart, which includes this data by year.
The data shows an increase of over 50% overall between 2010 and 2011, most evident in Human Factors and Operative Care, which both grew almost 30%. The good news is that there is a substantial reduction in all categories in 2012. Given the disclaimers below, this begs the question of whether there was truly some improvement in the industry or a simple decision not to review as many cases for some other reason.
Caveats and Larger Questions
It all sounds good and like a plausible narrative, right? Not too fast… TJC states clearly that this data is not representative of the industry overall, which given the estimated 100,000+ annual deaths in hospitals (i.e., Sentinel Events) due to HAI and Medical Error, makes sense. The disclaimer:
“Data Limitations: The reporting of most sentinel events to The Joint Commission is voluntary and represents only a small proportion of actual events. Therefore, these data are not an epidemiologic data set and no conclusions should be drawn about the actual relative frequency of events or trends in events over time.â€
We understand the disclaimer and that the data are used to inform Sentinel Event alerts and improve accreditation survey questions, but also have to wonder out loud why so few examples within such a large universe of opportunities…
While reviewing the data by year, we also did not see any reference or spike in the data in 2005 to account for the 330+ Inpatients and LTC residents who perished in the Katrina tragedy.
In short the question is –  given these data limitations and subjective inclusion of information, why did I just spend two hours analyzing these “statistics” and is this data useful for anything other than for anecdotal references of bad things that might happen?


0 Comments